| University | London Metropolitan University (LMU) |
|---|---|
| Subject | Understanding and Managing Data |
PART 1
Task 1: Sample Data
To gain insights into the typical price consumers are willing to pay for a bag, a bag designer randomly selected 42 designs from its summer collection. The data have been made available in the Excel file named “MN4063 Autumn CWK 1 Data” under the tab labeled Task 1.
Required for Task 1
1. Using the ungrouped data for Task 1 and the pivot table function in Excel, create an appropriately grouped frequency table (with six intervals) to summarise the price data. Both absolute and percentage frequencies should be presented on the same frequency table. Percentage frequencies should be rounded appropriately. Copy the table into your Word document.
2. Using the ungrouped data for Task 1, calculate relevant descriptive statistics to summarise the price data. Values should be rounded to a correct number of decimal places. At a minimum, you should calculate the mean, standard deviation, range, median and interquartile range. Present your statistics in a table. Copy the table into your Word document. The Excel formulae used
should also be shown, where applicable.
Task 2: Networking
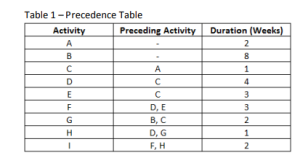
A project consists of 9 activities, each with a specific duration stated in weeks. For example, Activity E takes 3 weeks to complete and can only be started after Activity C has been completed. Information on the 9 activities is outlined in the precedence table (Table 1) below.
Do You Need Assignment of This Question
Required for Task 2
1. With reference to Table 1, construct a network diagram by going through the forward and backward passes. You may draw your network diagram in Excel or Word. NB: An image of a handdrawn network diagram will not be accepted and will not receive marks. The network diagram needs to be copied into your Word file.
2. With reference to the network diagram created under (1) above, identify the critical path and state the duration of the project.
Task 3: Probability
In a recent survey, 70% of respondents were male and 30% of all male respondents did not own a car. In total, 25% of respondents did not own a car.
Required for Task 3
1. Construct a contingency table by using the information above. All values in the contingency table should be shown as proportions and not percentages.
2. With reference to the contingency table prepared under (1) above, what is the chance that a respondent chosen at random is female and owns a car? Use the correct notation and state the problem in full. The probability should be shown as a proportion.
Task 4: Relationships
To operate more effectively, a retailer wants to better understand the relationship between sales revenue, total costs, average order value and gross profit. To this end, data for the past 12 months were made available. To complete task 4, refer to the data provided under the tab named “Task 4” in the “MN4063 Autumn CWK 1 Data” Excel file.
Required for Task 4
1. Using the data for Task 4, construct a correlation matrix in Excel to show the correlation coefficients between Sales Revenue (£’000) and Total Costs (£’000), Average Order Value (£) and Gross Profit (£’000). The correlation matrix needs to be copied into your Word file.
2. With reference to the correlation matrix, identify the ‘best’ predictor of Sales Revenue (£’000).
Buy Answer of This Assessment & Raise Your Grades
Struggling with your assignments? Look no further! Our platform offers comprehensive assignment writing help in the UK to students at London Metropolitan University (LMU). Whether it’s the challenging Understanding and Managing Data Assignment or any other subject, our experts are here to provide you with the assistance you need. In this assignment, you will gain insights into the typical price consumers are willing to pay for a bag. Our experienced professionals are well-versed in management and data analysis, ready to guide you through this task. Don’t let academic challenges hold you back. Pay for our reliable Management Assignment Help and unlock your academic potential